Why Logstash
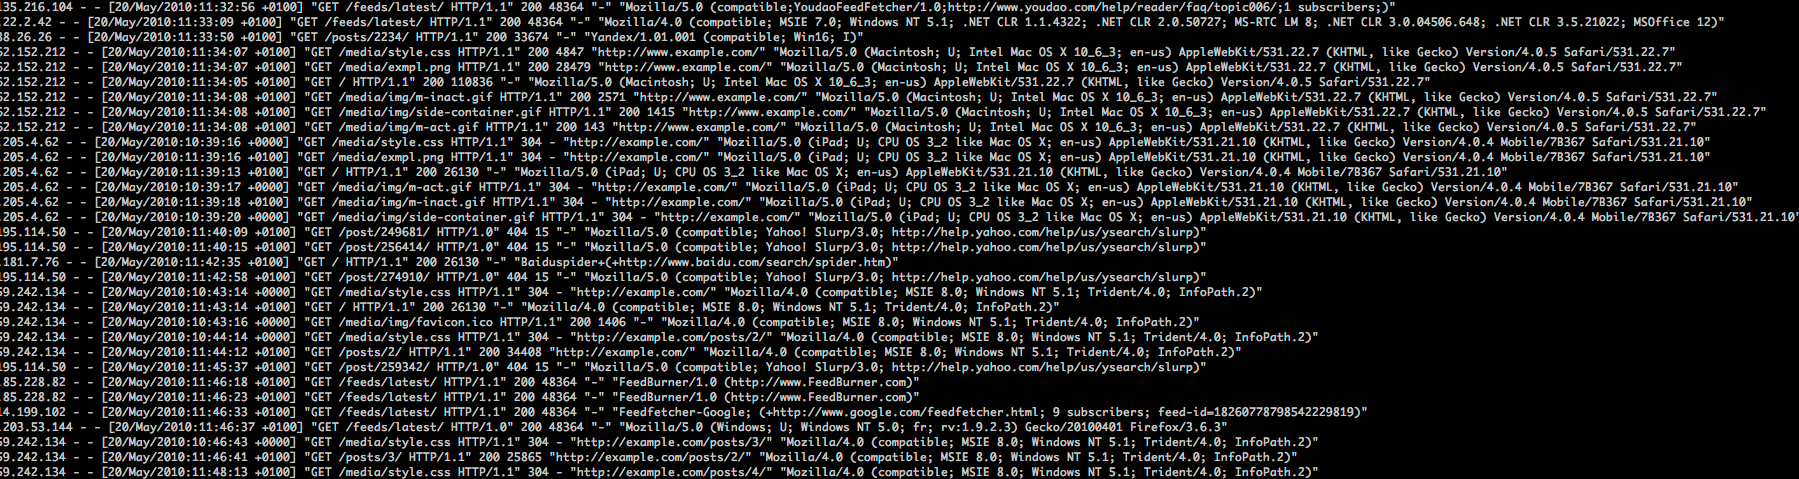
When your applications are receiving thousands of hits per second (maybe more), issues don’t crop up immediately. It’s a day later that a client e-mails in saying, “we saw some dropoffs between 4 am and 6 am 2 days ago.” And then you go grovelling to your sysadmins, asking them for access to logs from the past few days. If you’re lucky, they haven’t yet been rotated into oblivion. Did I also mention that these logs are spread across multiple nodes, for, you know, load balancing purposes. Next, you crack your knuckles and hope that the regex you’re trying to construct will comply. And if you’re like me, writing regex is like poking your eye with a finger. After about an hour or two of googling, you mush up a regex that works. Phew! You figure out what happened, tell the client, and continue with your day.
A month later, the same thing. And then you lament—why didn’t I just save that regex from the last time. Sigh.
This is where Logstash comes in. You consolidate all your logs into a searchable Elasticsearch (or Redis, etc.) instance. And Logstash ships with Kibana, so you have nice UI to Elasticsearch. You can save your queries, share the results, and even export the logs if needed.
Before we begin
Logstash is blessed with a great community that helps n00bs and is not of the mentality. I highly recommend that you read their documentation, which is extensive. And before you begin, definetely watch this excellent intro video by Jordan Sissel of Dreamhost.
Pre-requisites
Today, I am just outlining a basic procedure to get this setup up and running on a single machine. Purpose is to log all the steps I followed to set this up and play around with it. And then you can move this setup to play with your production system.
My setup was
- Ubuntu
- Java 1.7.0_45-b18
- Logstash 1.4.2 (the latest stable version at the time of writing)
- Elasticsearch 1.4.2 (the version compatible with the above Logstash release)
Step I: Install and run Elasticsearch (ES)
I simply followed the instructions given on Logstash documentation
curl -O https://download.elasticsearch.org/elasticsearch/elasticsearch/elasticsearch-1.4.2.tar.gz
tar zxvf elasticsearch-1.4.2.tar.gz
cd elasticsearch-1.4.2/
./bin/elasticsearch
This will start ES on the port 9200. You can make sure that everything’s fine by going to http://localhost:9200/_search.
Step II: Install and run Logstash (LS)
Again, straightforward
curl -O https://download.elasticsearch.org/logstash/logstash/logstash-1.4.2.tar.gz
tar zxvf logstash-1.4.2.tar.gz
cd logstash-1.4.2
Before you run this, let’s start with a simple config file for LS called logstash.conf
input {
  file {
    # Path to your apache access log file
    path => "/var/log/apache2/other_vhosts_access.log"
    # Arbitrary type for identification during filtering
    type => "apache-access"
    # Something that makes sense to you, in my case, this was the name of my box
    tags => [ "bl-aphatarpekar-d01" ]
    start_position => "beginning"
  }
}

filter {
  if [type] == "apache-access" {
    grok {
      match => [ "message", "%{COMBINEDAPACHELOG}" ]
    }
  }
}

output {
  # stdout { codec => rubydebug } (Uncomment this line if you want to see how LS is sending the logs to ES)
  elasticsearch {
    host => "localhost"
    # The default port that ES consumes on
    port => "9300"
  }
}
Now, run LS
bin/logstash -f logstash.conf webThis will start LS on the default port 9292. You can access the shipped Kibana at http://localhost:9292/. If you wish to change the port, simply specify it in the above command:
bin/logstash -f logstash.conf web --port 8105Important ES stuff
Cross-Origin errors when Kibana tries to access ES
I kept getting the following error when I tried access the logs via Kibana
XMLHttpRequest cannot load http://localhost:9200/_nodes. No 'Access-Control-Allow-Origin' header is present on the requested resource. Origin 'https://kibana.xxxxxxxxxxxxx.xxx' is therefore not allowed access. This is actually an issue with ES. I modified the ES config/elasticsearch.yaml file to enable cors. I simply added the following lines to the file
# Allow cross-origin stuff
http.cors.allow-origin: "/.*/"
http.cors.enabled: true
And now restart ES.
Confirm that ES is receiving logs
The URL to use when trying to check ES’s indices is http://www.bl-aphatarpekar-d01.visualdna.com:9200/_cat/indices?v. It will output something like
health status index               pri rep docs.count docs.deleted store.size pri.store.size
yellow open   logstash-2015.01.28   5   1         47            0    303.7kb        303.7kb
The number corresponding to docs.count indicates the number of log lines in ES.
Clear ES index
After you’re done playing around, you’d want to plug your production logs into the system. To delete an existing index from ES, first obtain the index name using the URL given above. In my case, it was logstash-2015.01.28. Next, issue a CURL DELETE to it:
curl -XDELETE 'http://localhost:9200/logstash-2015.01.28'How do I ship remote logs into my LS
Short answer is using logstash-forwarded and lumberjack. A better primer of it is availble here.